How FEPI Kept Pace With The Nasdaq 100, Despite High Income Generation
OTM Positioning and Total Return
Important notice: Cash distributions discussed in this document may include return of capital and should not be interpreted as investment performance or economic gain.
Executive Summary (TLDR)
REX designed its covered call ETFs to capture both income and upside by positioning call options further out-of-the-money (OTM) in higher implied volatility stocks.
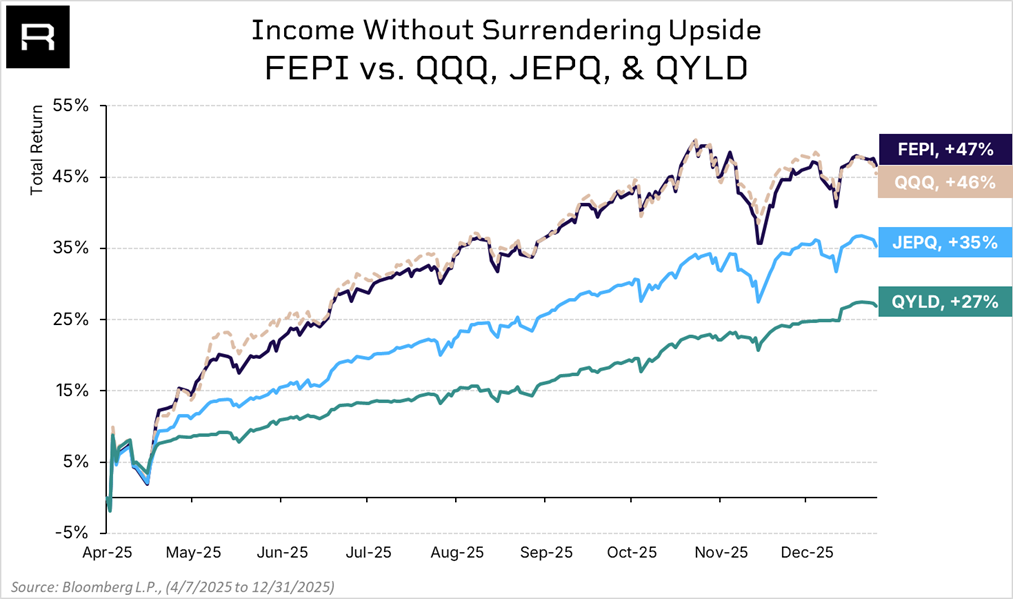
Over the period analyzed, this structure delivered total returns that kept pace with a growth-oriented Nasdaq-100 ETF (ticker: QQQ) and materially outperformed two leading Nasdaq-focused equity income ETFs (ticker: JEPQ and QYLD).
Here’s what the data shows:
The performance period beginning on April 8, 2025 was selected to capture a period of elevated market volatility and broad equity dislocation, followed by a sustained equity rally. This provides a useful backdrop for evaluating how different covered call structures respond from a market trough into a subsequent equity rally.
During this period, four strategies operated within the same macro environment:
- QQQ: a growth-oriented Nasdaq-100 benchmark offering full upside participation
- FEPI: a concentrated, large-cap technology and innovation portfolio with single-stock covered call overlays, targeting meaningful upside with option income
- JEPQ: a Nasdaq-focused equity income strategy providing partial upside through option-based yield generation
- QYLD: a Nasdaq-100 covered call strategy offering high income potential but very limited upside participation
The purpose of the comparison is not to assess security selection or market timing, but to isolate how differences in portfolio construction and option implementation influence return outcomes.
To provide context for FEPI’s results, the chart and table below compare FEPI with QQQ, JEPQ, and QYLD, framing the trade-off between equity participation and income generation within a similar sector and volatility environment.
| Fund | Market Price Return | NAV Return | Total Return (Assumes Reinvestment of Distributions, Which Includes Return of Capital) | Income Component** | Current 30 Day SEC Yield* | Gross Expense Ratio |
|---|---|---|---|---|---|---|
| REX FANG & Innovation Equity Premium Income ETF, FEPI | 21.24% | 20.97% | 46.61% | 25.64% | -0.38% | 0.65% |
| Invesco QQQ ETF, QQQ | 44.99% | 44.83% | 45.51% | 0.68% | 0.46% | 0.18% |
| JPMorgan Nasdaq Equity Premium Income ETF, JEPQ | 24.43% | 24.48% | 35.33% | 10.85% | 11.58% | 0.35% |
| Nasdaq 100 Covered Call ETF, QYLD | 15.87% | 15.94% | 26.87% | 10.93% | 0.07% | 0.60% |
**Income Component represents the difference between Total Return (assumes reinvestment of distributions, which includes return of capital) and NAV Return over the measurement period.
*The 30-Day SEC Yield represents net investment income, which excludes option income, earned by such ETF over the 30-Day period, expressed as an annual percentage rate based on such ETF’s share price at the end of the 30-Day period.
The performance data quoted represents past performance. Past performance does not guarantee future results. The investment return and principal value of an investment will fluctuate. An investor’s shares, when redeemed, may be worth more or less than their original cost; current performance may be lower or higher than the performance quoted. Returns for performance for one year and under are cumulative, not annualized. Short term performance, in particular, is not a good indication of the fund’s future performance, and an investment should not be made based solely on returns. For additional information, see the fund(s) prospectus. Current performance may be lower or higher than the performance data quoted. The most recent month-end performance can be obtained by calling 1-844-802-4004. The average annual total return figures reflect the reinvestment of dividends and capital gains, if any.
The OTM-ness Principle
When a covered call is sold, future upside beyond the strike price is exchanged for immediate premium income. The relationship between strike distance and premium collected is not linear and is heavily influenced by implied volatility.
At lower levels of implied volatility, moving a call further OTM typically results in a disproportionate reduction in premium. At higher levels of implied volatility, that trade-off becomes less severe. In practical terms, this means that at higher implied volatility levels, a strategy may be able to position strikes further from spot prices while still collecting meaningful income.
- Lower volatility (~25% implied volatility): Moving from a 1% OTM to a 5% OTM strike reduced estimated monthly premium from approximately 2.5% to 1.2% (~50% decline)
- Higher volatility (~50% implied volatility): The same shift in strike distance reduced estimated monthly premium from approximately 5.4% to 3.9% (~25% decline)
These examples highlight how elevated implied volatility can support wider strike distances with less proportional sacrifice to premium, helping income generation and equity participation coexist more effectively.
FEPI: Application of OTM Positioning at the Security Level
FEPI implements its covered call strategy at the individual stock level across a concentrated portfolio of large-cap technology and innovation companies.
This volatility profile supports:
- Greater flexibility in strike distance selection
- The ability to position calls further OTM (typically 5% to 7%) while still generating meaningful premium
- A return profile that reflects both option income and retained equity participation
Structural Comparisons
FEPI vs. QQQ: Growth Benchmark Perspective
QQQ is designed to provide full exposure to the price performance of large-cap Nasdaq-listed growth companies. Its return profile is therefore dominated by market price appreciation, with distributions playing a minimal role in total return outcomes.
FEPI, by contrast, introduces a second return component through option income. While this structure can reduce participation beyond the selected strike levels, the use of further OTM positioning at the individual stock level is intended to retain participation in strong equity rallies.
The distinction between the two strategies is structural:
- QQQ maximizes exposure to price appreciation
- FEPI balances price participation with income generation
The results show that similar total return outcomes can be achieved with different mixes of income and upside participation, shaped by strike selection. During the period analyzed, FEPI exceeded QQQ’s total return by 1.10%.
FEPI vs. JEPQ: Volatility Source and Option Structure
While both FEPI and JEPQ are positioned as equity income strategies with significant exposure to large-cap growth and technology-oriented companies, their option implementations differ materially.
JEPQ generates income primarily through equity-linked option exposure via equity-linked notes tied to the Nasdaq. Index-level implied volatility is structurally lower and more stable than single-stock volatility, which generally limits how far strikes can be moved OTM without a meaningful reduction in premium collected.
These structural differences lead to distinct return profiles:
- FEPI emphasizes flexibility in upside participation alongside income generation through wider OTM positioning at the individual stock level
- JEPQ emphasizes income stability and volatility dampening through index-linked option exposure
This highlights how differences in option structure and volatility source can shape income and upside participation. During the period analyzed, this structural difference contributed to FEPI outperforming JEPQ by +11.28%.
FEPI vs. QYLD: Upside Capture, Strike Selection, and Volatility
Although FEPI and QYLD both seek to deliver equity income from tech-oriented, large-cap growth exposure, they pursue that goal through notably different option structures.
QYLD seeks to track a Nasdaq-100 buy-write benchmark by owning the Nasdaq-100 and systematically selling one-month, at-the-money index calls. This approach is designed to maximize premium and steady cash flow, but it begins capping gains almost immediately as the index advances, which structurally suppresses upside in strong or persistent rallies.
FEPI, by contrast, applies its option overlay at the individual stock level with OTM strikes, allowing more room for equity appreciation before upside is called away.
As a result, the two strategies exhibit distinct return profiles:
- FEPI is designed to balance option income with more meaningful upside participation by using slightly out-of-the-money calls on concentrated, higher-volatility tech names.
- QYLD is designed primarily for steady, recurring distributions by selling at-the-money calls on the Nasdaq-100, accepting that total return will be heavily constrained in strong bull phases.
Over the period examined, this combination of deeper upside “runway” (via out-of-the-money single-stock calls) and exposure to a concentrated tech basket was a key contributor to FEPI’s ability to participate more in market strength and ultimately outperform QYLD.
How OTM-ness Contributed to FEPI’s Upside (+21.24% Price Appreciation)
- Stock-level exposure to high-growth leaders (NVDA, PLTR, TSLA, NFLX, META, among others), where implied volatility and option premiums are structurally higher.
- Wider strike positioning, with calls typically written 5%–7% OTM rather than the 1%–3% common in index-based strategies.
- Upside participation retained, allowing equity rallies to contribute meaningfully to total return while still generating income.
View the full fund’s holdings here: https://www.rexshares.com/fepi/
Looking Ahead
Post-2020 market conditions reflect a structurally higher volatility regime than the prior decade, supporting wider OTM positioning without a proportional reduction in income. FEPI’s 46.61% total return (market price plus reinvested distributions) over the period analyzed illustrates how OTM positioning can support both income and equity participation in an elevated volatility environment.
- Volatility is likely to remain structurally higher amid ongoing geopolitical and policy uncertainty.
- Wider strike positioning becomes more efficient as implied volatility rises, reducing the trade-off between premium and upside.
- Stock-level strategies can capture dispersion in volatility and returns that index-based approaches smooth away.
- Income and growth need not be mutually exclusive when strike selection is aligned with volatility conditions.
The Bottom Line
The relationship between implied volatility and premium capture is asymmetric.
Writing calls 5%–7% OTM rather than 1%–3% reduces immediate relative premium, but preserves more upside when markets rally and seeks to preserve downside cushioning through option income.
In 2025’s market rally, this structure translated into strong total return alongside meaningful income generation. For investors seeking exposure to high-growth equities without abandoning cash flow, FEPI’s performance during this period illustrates a different path to total return.
Performance data: April 8, 2025 – December 31, 2025. Past performance is not indicative of future results. All investments carry risk, including possible loss of principal. Distributions are not guaranteed. Please see fund prospectus for complete details and risk disclosures.
To provide context on FEPI’s income-oriented approach, the comparison below includes QYLD and JEPQ as a widely followed equity income ETF and QQQ as a broad U.S. equity market benchmark. The goal is to highlight structural differences in objectives, portfolio management, and risk exposures that can lead to different return profiles.
| Fund | FEPI | JEPQ | QQQ | QYLD |
|---|---|---|---|---|
| Objective | Capital appreciation and current income. | The Fund seeks current income while maintaining prospects for capital appreciation. | The Invesco QQQ Trust SM, Series 1 (the “Fund” or “Trust”) seeks to track the investment results, before fees and expenses, of the Nasdaq-100 Index® (the “Underlying Index”). | The Global X NASDAQ 100® Covered Call ETF (the “Fund”) seeks to provide investment results that closely correspond, before fees and expenses, generally to the price and yield performance of the Cboe NASDAQ-100® BuyWrite V2 Index (the “Underlying Index”). |
| Strategy Summary | The Fund uses a covered call strategy to provide income and exposure to the share price returns of the companies comprising the Index. | The investment objective of the Fund is to seek current income while maintaining prospects for capital appreciation. The Fund seeks to achieve this objective by (1) creating an actively managed portfolio of equity securities comprised significantly of those included in the Fund’s primary benchmark, the Nasdaq-100 Index® (the Benchmark), and (2) through equity-linked notes (ELNs), selling call options with exposure to the Benchmark. The resulting Fund is designed to provide investors with performance that captures a majority of the returns associated with the Benchmark, while exposing investors to lower volatility than the Benchmark and also providing incremental income. | The Trust seeks to achieve its investment objective by holding a portfolio of the common stocks that are included in the Index (the “Portfolio”), with the weight of each stock in the Portfolio substantially corresponding to the weight of such stock in the Index. | The Global X Nasdaq 100 Covered Call ETF (QYLD) seeks to provide investment results that correspond generally to the price and yield performance, before fees and expenses, of the Cboe Nasdaq-100 BuyWrite V2 Index. |
| Management Style | Active | Active | Passive | Active |
| Benchmark | Solactive FANG Innovation Index | Nasdaq-100 Index® | Nasdaq-100 Index® | Cboe NASDAQ-100® BuyWrite V2 Index |
| Inception Date | 10/11/2023 | 5/3/2022 | 3/10/1999 | 12/11/13 |
| AUM | $603.53m | $33.94bn | $408.54bn | $8.36B |
| Prospectus | Link | Link | Link | Link |
| Standardized Performance | Link | Link | Link | Link |
Disclosures
Investing in the Fund involves a high degree of risk. As with any investment, there is a risk that you could lose all or a portion of your investment in the Fund.
Before investing you should carefully consider the Fund’s investment objectives, risks, charges and expenses. This and other information is in the prospectus. Please read the prospectuses carefully before you invest. Investments involve risk. Principal loss is possible. For FEPI prospectuses, click here.
THE FUND, TRUST, ADVISER, AND SUB-ADVISER ARE NOT AFFILIATED WITH THE FUND’S UNDERLYING SECURITIES.
The Fund’s investment exposure is concentrated in the same industries as that assigned to the underlying securities. Some or all of these risks may adversely affect the Fund’s net asset value (“NAV”) per share, trading price, yield, total return, and/or ability to meet its investment objective.
The value of the Fund, which focuses on underlying securities in the technology sector, may be more volatile than a more diversified pooled investment or the market as a whole and may perform differently from the value of a more diversified pooled investment or the market as a whole.
Nasdaq-100. The Nasdaq-100 is a stock market index designed to measure the performance of 100 of the largest non-financial companies listed on the Nasdaq Stock Market, selected and weighted by market capitalization across sectors such as technology, telecommunications, retail, and biotechnology.
The CBOE Nasdaq-100 BuyWrite Index. Measures the total rate of return of a Nasdaq-100 covered call strategy that holds a portfolio linked to the Nasdaq-100 Index and sells a succession of one-month, at-the-money Nasdaq-100 call options.
Sector Concentration Risk. The trading prices of the Fund’s underlying securities may be highly volatile and could continue to be subject to wide fluctuations in response to various factors. The stock market in general, and the market for technology companies in particular, where applicable, has experienced extreme price and volume fluctuations that have often been unrelated or disproportionate to the operating performance of those companies.
Liquidity Risk. Some securities held by the Fund, including options contracts, may be difficult to sell or be illiquid, particularly during times of market turmoil.
Derivatives Risk. Derivatives are financial instruments that derive value from the underlying reference asset or assets, such as stocks, bonds, or funds (including ETFs), interest rates or indexes. The Fund’s investments in derivatives may pose risks in addition to, and greater than, those associated with directly investing in securities or other ordinary investments, including risk related to the market, imperfect correlation with underlying investments or the Fund’s other portfolio holdings, higher price volatility, lack of availability, counterparty risk, liquidity, valuation and legal restrictions.
Call Writing Strategy Risk. The path dependency (i.e., the continued use) of the Fund’s call writing strategy will impact the extent that the Fund participates in the positive price returns of the underlying reference securities and, in turn, the Fund’s returns, both during the term of the sold call options and over longer time period.
High Portfolio Turnover Risk. The Fund may actively and frequently trade all or a significant portion of the Fund’s holdings. A high portfolio turnover rate increases transaction costs, which may increase the Fund’s expenses.
New Fund Risk. The Fund is a recently organized management investment company with no operating history. As a result, prospective investors do not have a track record or history on which to base their investment decisions.
Non-Diversification Risk. Because the Fund is non-diversified, it may invest a greater percentage of its assets in the securities of a single issuer or a smaller number of issuers than if it was a diversified fund.
Distribution Risk. As part of the Fund’s investment objective, the Fund seeks to provide current monthly income. There is no assurance that the Fund will make a distribution in any given month. If the Fund does make distributions, the amounts of such distributions will likely vary greatly from one distribution to the next. Additionally, the monthly distributions, if any, may consist of returns of capital, which would decrease the Fund’s NAV and trading price over time. As a result, an investor may suffer significant losses to their investment.
NAV Erosion Risk Due to Distributions. When the Fund makes a distribution, the Fund’s NAV will typically drop by the amount of the distribution on the related ex-dividend date. The repeated payment of distributions by the Fund, if any, may significantly erode the Fund’s NAV and trading price over time. As a result, an investor may suffer significant losses to their investment.
Options Contracts. The use of options contracts involves investment strategies and risks different from those associated with ordinary portfolio securities transactions. The prices of options are volatile and are influenced by, among other things, actual and anticipated changes in the value of the underlying instrument, including the anticipated volatility, which are affected by fiscal and monetary policies and by national and international political, changes in the actual or implied volatility of the underlying reference security, the time remaining until the expiration of the option contract and economic events. For the Fund in particular, the value of the options contracts in which it invests are substantially influenced by the value of the underlying securities.
Money Market Securities Risk. The Fund may invest in money market securities, which are short-term, highly rated fixed income securities. Although money market securities typically carry lower risk than equity securities, return of principal and interest may not be guaranteed.
Index: The Solactive® FANG Innovation Index includes 15 highly liquid stocks focused on technology. These large, tech-enabled equity securities are all listed and domiciled in the U.S. The Index is comprised of eight core-components Apple (AAPL), Amazon (AMZN), Meta Platforms (META), Alphabet (GOOGL), Microsoft (MSFT), Netflix (NFLX), NVIDIA (NVDA), Tesla (TSLA) AND the seven top traded names across the technology sector.
Out of the Money Option: An out of the money call option has a strike price that is higher than the price of the underlying asset.
Call Option: Call options are financial contracts that give the buyer the right—but not the obligation—to buy a stock, bond, commodity, or other asset or instrument at a specified price within a specific period.
Market Price: The current price at which shares are bought and sold. Market returns are based upon the last trade price.
NAV: The dollar value of a single share, based on the value of the underlying assets of the fund minus its liabilities, divided by the number of shares outstanding. Calculated at the end of each business day.
30-Day SEC Yield: The 30-Day SEC Yield represents net investment income, which excludes option income, earned by such ETF over the 30-Day period, expressed as an annual percentage rate based on such ETF’s share price at the end of the 30-Day period.
Implied Volatility: A measure of the market’s expectation of future price fluctuations for a security, derived from the current market price of an option on that security. Higher implied volatility generally reflects greater expected price movement and typically results in higher option premiums.
Funds distributed by: Foreside Fund Services, LLC, not affiliated with Rex Shares, LLC, or its affiliates.