
REX FANG & Innovation Equity Premium Income ETF (FEPI) April 2026 Commentary
April Recap: Capturing the Rally With Premium Intact
Key Highlights
- Performance (April): FEPI: 10.72% | S&P 500 Index: 10.49%
- Performance (YTD): FEPI: 2.92% | S&P 500 Index: 5.70%
- Premium Income: 2.46%
- Distribution: 2.11%
- Distribution Rate: 25.21%
- 30-Day SEC Yield: -0.32% (as of 4/30/2026)
- Average Roll Moneyness: ~10% out-of-the-money (Range: ~8%-13%)
- Roll Date: 4/14/26
- Gross Expense Ratio: 0.65%
The 30-Day Yield represents net investment income earned by the Fund over the 30-Day period ended 4/30/2026, expressed as an annual percentage rate based on the Fund’s share price at the end of the 30-Day period. The 30-Day unsubsidized SEC Yield does not reflect any fee waivers/reimbursements/limits in effect.
The Distribution Rate is the annual rate an investor would receive if the most recently declared distribution, which includes option income, remained the same going forward. The Distribution Rate is calculated by multiplying an ETF’s Distribution per Share by twelve (12), and dividing the resulting amount by the ETF’s most recent NAV. The Distribution Rate represents a single distribution from the ETF and does not represent its total return. The distribution may include a combination of ordinary dividends, capital gain, and return of investor capital and has the potential to change during any given tax year. Please refer to the 19a-1 Notice, which can be located on the Fund’s website, regarding the composition of distributions, including return of capital. Final determination of a distribution’s tax character will be made on Form 1099 DIV.
Commentary
- Implied volatility on the underlying constituents remained elevated in April (~49.8% weighted average), supporting premium generation of ~2.5%. The Fund distributed ~2.1%, consistent with its monthly cadence.
- Following the April 14th roll, strikes were positioned ~10.5% out-of-the-money on average (range: ~8%–13%). Despite a sharp rally, 11 of 15 positions remained below their strikes by month-end, with only 4 names — primarily semiconductors — breaching strikes. FEPI’s total return of +10.72% effectively matched the S&P 500 TR Index (+10.49%), demonstrating that the deep OTM positioning allowed the fund to capture nearly all broad market upside while continuing to generate premium income.
- The April outcome illustrates the return-path dynamic in reverse relative to March: where post-roll weakness preserved fuller premium capture with minimal opportunity cost, the sharp recovery in April meant some upside was ceded in names that rallied past strikes, with premium income (~2.5%) helping to offset the gap.
Performance Summary
As of 4/30/2026 • Since Inception reflects FEPI’s inception date: 10/11/23
| Total Return | 1M | 3M | YTD | 1Y | Since Inception |
|---|---|---|---|---|---|
| Market | 10.89% | 4.74% | 2.87% | 33.68% | 19.30% |
| NAV | 10.72% | 4.93% | 2.92% | 33.55% | 19.60% |
| S&P 500 TR | 10.49% | 4.19% | 5.70% | 31.05% | 23.39% |
For current standardized performance, click here.
The performance data quoted represents past performance. Past performance does not guarantee future results. The investment return and principal value of an investment will fluctuate so that an investor’s shares, when sold or redeemed, may be worth more or less than their original cost and current performance may be lower or higher than the performance quoted. Performance current to the most recent month-end can be obtained by calling 844-802-4004. Short term performance, in particular, is not a good indication of the fund’s future performance, and an investment should not be made based solely on returns.
April Premium vs. Distribution
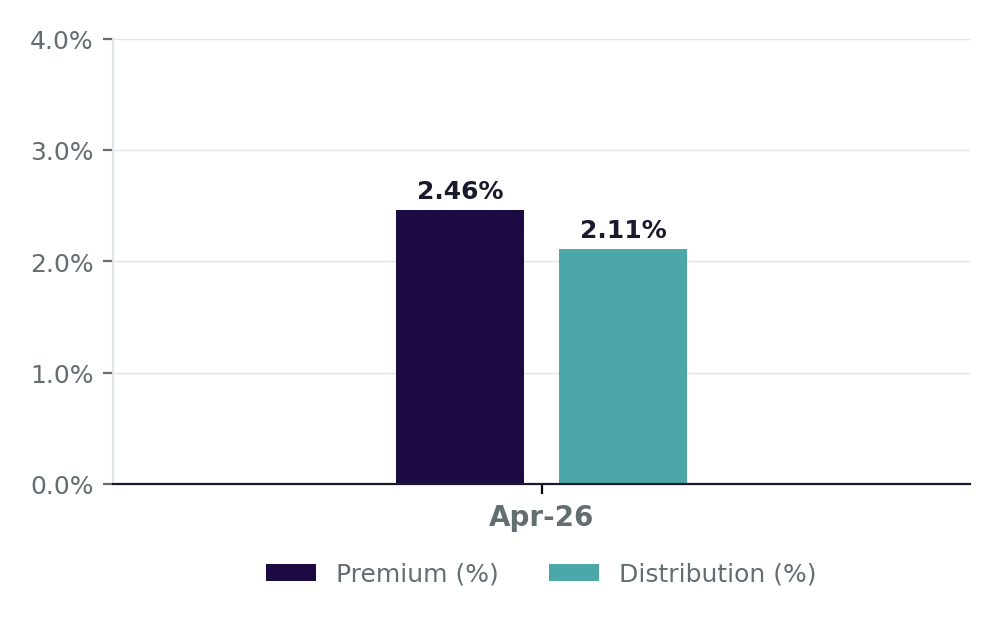
Premium (%) represents the total option premium collected as a percentage of fund NAV for that month. Distribution (%) represents the monthly distribution paid to shareholders as a percentage of fund NAV. Distribution Support represents the difference between the average premium collected and the average distribution paid. Past premiums are not indicative of future premiums. Distributions are not guaranteed.
Source: Bloomberg, Vident, REX. All data as of 4/30/26 unless otherwise stated. Premium income and moneyness are representative of positions initiated on the 4/14/26 monthly option roll.
Investing in the Fund involves a high degree of risk. As with any investment, there is a risk that you could lose all or a portion of your investment in the Fund.
Before investing you should carefully consider the Fund’s investment objectives, risks, charges and expenses. This and other information is in the prospectus. Please read the prospectuses carefully before you invest. Investments involve risk. Principal loss is possible. For FEPI prospectuses, click here.
THE FUND, TRUST, ADVISER, AND SUB-ADVISER ARE NOT AFFILIATED WITH THE FUND’S UNDERLYING SECURITIES.
The Fund’s investment exposure is concentrated in the same industries as that assigned to the underlying securities. Some or all of these risks may adversely affect the Fund’s net asset value (“NAV”) per share, trading price, yield, total return, and/or ability to meet its investment objective. The value of the Fund, which focuses on underlying securities in the technology sector, may be more volatile than a more diversified pooled investment or the market as a whole and may perform differently from the value of a more diversified pooled investment or the market as a whole.
Sector Concentration Risk. The trading prices of the Fund’s underlying securities may be highly volatile and could continue to be subject to wide fluctuations in response to various factors. The stock market in general, and the market for technology companies in particular, where applicable, has experienced extreme price and volume fluctuations that have often been unrelated or disproportionate to the operating performance of those companies.
Liquidity Risk. Some securities held by the Fund, including options contracts, may be difficult to sell or be illiquid, particularly during times of market turmoil.
Derivatives Risk. Derivatives are financial instruments that derive value from the underlying reference asset or assets, such as stocks, bonds, or funds (including ETFs), interest rates or indexes. The Fund’s investments in derivatives may pose risks in addition to, and greater than, those associated with directly investing in securities or other ordinary investments, including risk related to the market, imperfect correlation with underlying investments or the Fund’s other portfolio holdings, higher price volatility, lack of availability, counterparty risk, liquidity, valuation and legal restrictions.
Call Writing Strategy Risk. The path dependency (i.e., the continued use) of the Fund’s call writing strategy will impact the extent that the Fund participates in the positive price returns of the underlying reference securities and, in turn, the Fund’s returns, both during the term of the sold call options and over longer time period.
High Portfolio Turnover Risk. The Fund may actively and frequently trade all or a significant portion of the Fund’s holdings. A high portfolio turnover rate increases transaction costs, which may increase the Fund’s expenses.
New Fund Risk. The Fund is a recently organized management investment company with no operating history. As a result, prospective investors do not have a track record or history on which to base their investment decisions.
Non-Diversification Risk. Because the Fund is non-diversified, it may invest a greater percentage of its assets in the securities of a single issuer or a smaller number of issuers than if it was a diversified fund.
Distribution Risk. As part of the Fund’s investment objective, the Fund seeks to provide current monthly income. There is no assurance that the Fund will make a distribution in any given month. If the Fund does make distributions, the amounts of such distributions will likely vary greatly from one distribution to the next. Additionally, the monthly distributions, if any, may consist of returns of capital, which would decrease the Fund’s NAV and trading price over time. As a result, an investor may suffer significant losses to their investment.
NAV Erosion Risk Due to Distributions. When the Fund makes a distribution, the Fund’s NAV will typically drop by the amount of the distribution on the related ex-dividend date. The repeated payment of distributions by the Fund, if any, may significantly erode the Fund’s NAV and trading price over time. As a result, an investor may suffer significant losses to their investment.
Options Contracts. The use of options contracts involves investment strategies and risks different from those associated with ordinary portfolio securities transactions. The prices of options are volatile and are influenced by, among other things, actual and anticipated changes in the value of the underlying instrument, including the anticipated volatility, which are affected by fiscal and monetary policies and by national and international political, changes in the actual or implied volatility of the underlying reference security, the time remaining until the expiration of the option contract and economic events.
Money Market Securities Risk. The Fund may invest in money market securities, which are short-term, highly rated fixed income securities. Although money market securities typically carry lower risk than equity securities, return of principal and interest may not be guaranteed.
Funds distributed by: Foreside Fund Services, LLC, not affiliated with Rex Shares, LLC, or its affiliates.