

How Leveraged ETFs Work + Full 2x & Inverse ETF List | T-REX
Education
How Leveraged ETFs Work
A leveraged ETF seeks to deliver a multiple of an underlying asset’s return over a single trading day. A 2X leveraged ETF seeks 2X the underlying’s daily return, then resets its exposure at each market close. Because daily returns compound, returns over periods longer than one day are very likely to differ from the stated multiple.
This page explains the daily reset, the compounding math behind it, volatility decay, and the conditions under which a leveraged ETF can exceed or fall short of its stated multiple. Leveraged ETFs are complex products and are not suitable for all investors.
The Basics
What the daily reset actually is
A 2X daily leveraged ETF has one stated objective: seek 2X the underlying’s return on any single trading day. If the underlying rises 1% today, the fund seeks to rise 2%. If the underlying falls 1%, the fund seeks to fall 2%. That objective is measured over one day, and one day only.
To pursue that objective, the fund rebalances every trading day. At each market close, exposure is reset so the next session begins at exactly 2X the fund’s new net asset value. This is the mechanical step most investors never picture. A 2X ETF resets its leverage every single session.
That reset pattern, adding exposure after gains and cutting it after losses, is structurally the same as buying high and selling low. In a market that trends one direction, the pattern can work in the holder’s favor. In a market that chops sideways, it works against. The math is identical in both cases. Only the path changes.
The Reset, Step by Step
1. Underlying rises
The fund increases exposure. More notional is needed to maintain 2X on a now larger net asset value.
2. Underlying falls
The fund decreases exposure. Less notional is needed to maintain 2X on a now smaller net asset value.
3. The next day begins
Exposure sits at exactly the stated multiple again. Yesterday’s path is no longer in the ratio, but it is in the base.
The Math
Why 2X daily is not 2X over any other period
Here is the cleanest possible illustration. An underlying stock starts at $100. Over two trading days it moves up 10%, then down 9.09%, ending exactly where it started. A 2X ETF tracking it does not.
| Day | Underlying | 2X ETF |
|---|---|---|
| Start | $100.00 | $100.00 |
| End of Day 1 | +10.00%$110.00 | +20.00%$120.00 |
| End of Day 2 | -9.09%$100.00 | -18.18%$98.18 |
The underlying ended exactly where it started. The 2X ETF ended down 1.82%. Two days, no fees, no tracking error, just the math of compounded daily returns.
The cause is asymmetric base sizes. At the underlying level, the 10% gain and the 9.09% loss are each a $10 move that cancels out. For the 2X ETF, the 20% gain on Day 1 applies to a $100 base and produces $20. The 18.18% loss on Day 2 applies to a $120 base and produces $21.82. The percentage moves are still 2X the underlying’s. They are simply applied to different dollar amounts, and that asymmetry compounds.
Stretch this across 252 trading days of a volatile but sideways underlying and the asymmetry stops being a rounding error. It becomes the dominant feature of the return.
Volatility Decay
The bigger the swings, the bigger the gap
Volatility decay is the gap that opens between a leveraged ETF’s cumulative return and the stated multiple of the underlying’s cumulative return when the underlying moves up and down without trending. The two day example shows the mechanism. A full year shows the scale.
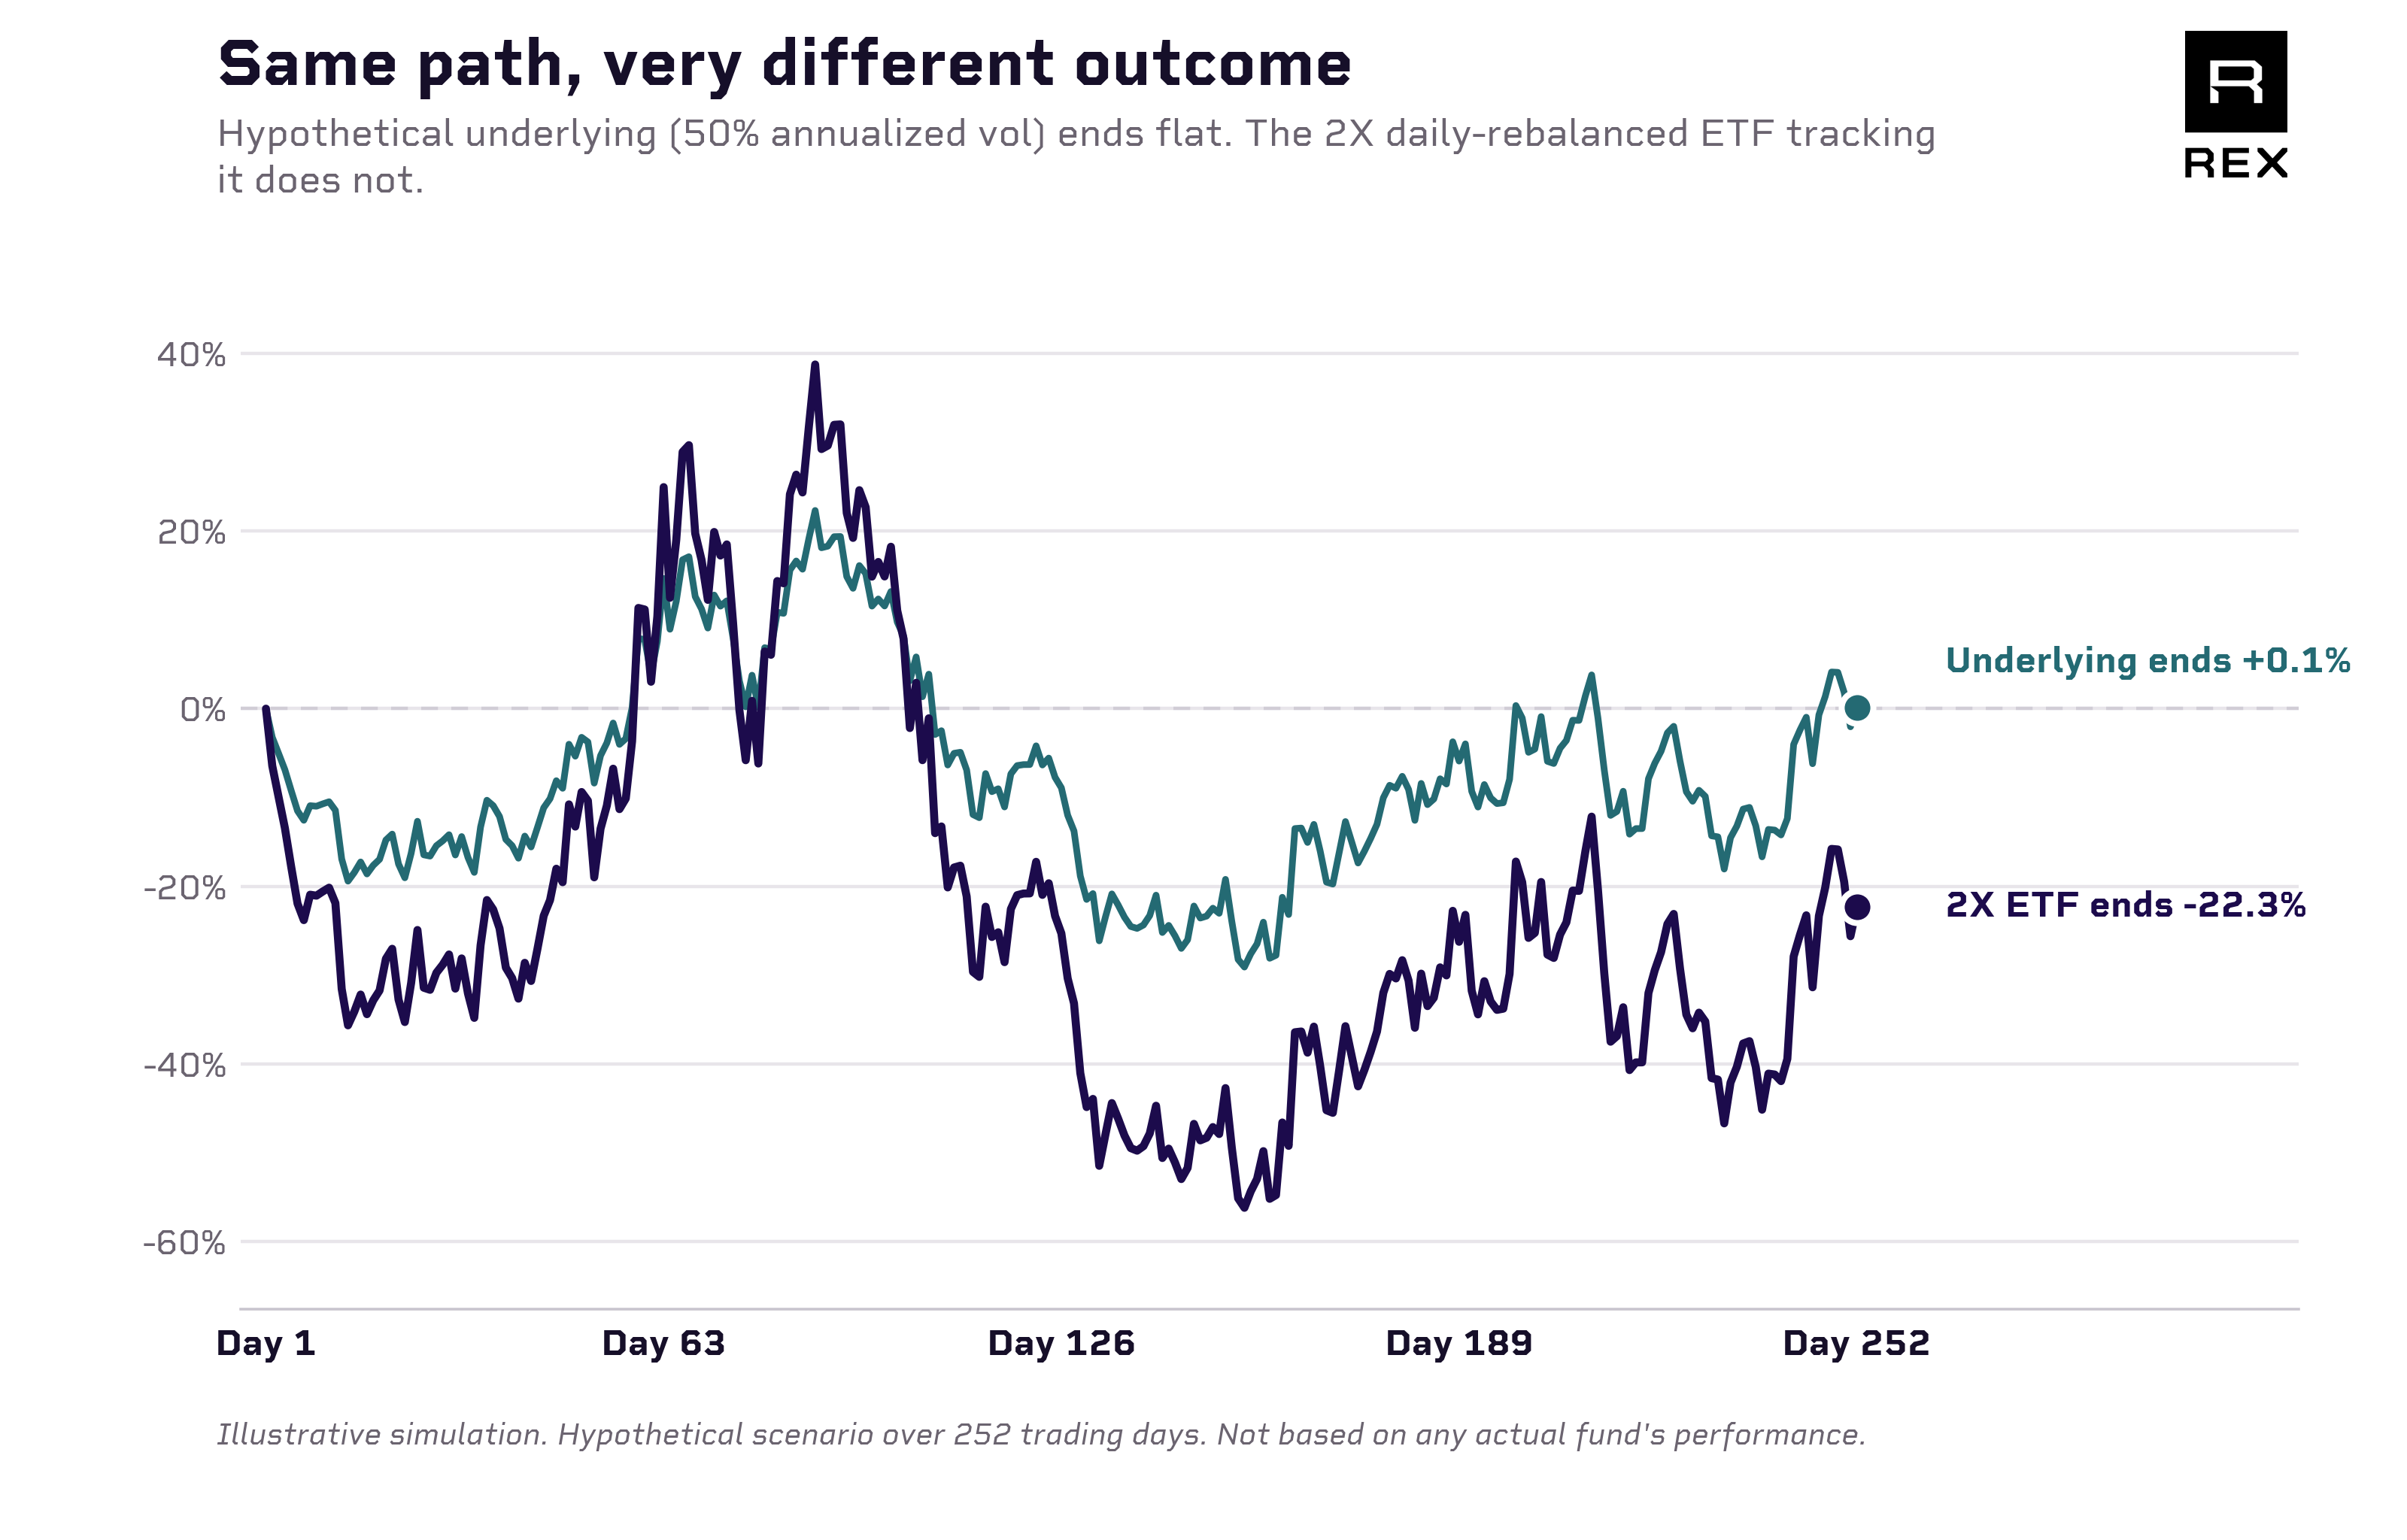
Both lines above start at zero and move with the same daily ups and downs. The 2X series simply doubles each day’s move in the underlying. Over a hypothetical year of trading, the underlying bounces around and ends roughly flat. The 2X series, riding the same path at double size, ends down about 22%.
How large that gap is depends on how choppy the year was. The more the underlying moved day to day, the larger the gap. The relationship grows fast. When volatility doubles, the expected gap more than triples.
Expected One Year Decay
Same start price. Same end price. Very different outcomes inside a 2X ETF.
A calm, blue chip style underlying might cost a 2X holder roughly 9% over a flat but bumpy year. A volatile single stock name running 70% to 100% annualized volatility can cost far more over that same flat year.
Hypothetical. Calculated from the standard daily rebalanced leverage formula on a flat underlying at each stated annualized volatility, before fees and expenses. Not based on any actual fund and not a projection of any fund’s results.
Market Regimes
The same math can work for the holder or against
Compounding is not one directional. The buying high and selling low pattern erodes returns when a market chops sideways. In a market that trends consistently, the same daily rebalancing can push cumulative returns past the stated multiple.
Daily compounding can add to returns
In a sustained uptrend the fund’s exposure grows each day, adding to a position that keeps winning. After many consecutive up days, the cumulative return can exceed 2X the underlying’s cumulative return. The same effect runs in reverse for a sustained downtrend, where an inverse or downside leveraged fund can exceed its multiple as exposure compounds in the direction of the move.
Daily compounding erodes returns
In a range bound market the fund repeatedly adds exposure into strength and cuts it into weakness, with no trend to reward the pattern. This is the condition that produces the decay figures above, and it is why a flat underlying can still produce a substantial loss in a 2X fund.
The compounding effect is small
When daily moves are modest, the gap between the fund’s cumulative return and the stated multiple stays modest in either direction. Low volatility does not remove the effect, it only shrinks it.
The compounding effect is large
Large daily moves make the gap large, in whichever direction the path determines. This is why single stock leveraged ETFs, which track individual companies rather than diversified indexes, tend to show bigger divergences than index based leveraged funds.
The practical takeaway is that a leveraged ETF’s return over any period longer than one day depends on the path, not just the endpoints. Two underlyings can finish a year at the same price while the leveraged ETFs tracking them finish with very different returns.
Single Stock
What is a single stock leveraged ETF?
A single stock leveraged ETF seeks a multiple of the daily return of one individual company’s stock rather than an index. The daily reset mechanics are identical to those described above. The difference is the underlying.
That difference matters because a single company is typically more volatile than a diversified index. Everything on this page scales with volatility, so the compounding effects tend to be larger in single stock leveraged ETFs than in index based ones, in both directions. Concentration in one issuer also means company specific events, including earnings, litigation, and management changes, drive the fund’s daily moves with no diversification to offset them.
Investing in a single stock leveraged ETF is not equivalent to investing directly in the underlying stock. These funds are designed for sophisticated investors who actively monitor and manage their positions, and they are not suitable for all investors.
Tracking Error
A separate effect, often confused with decay
Volatility decay comes from compounding across multiple days. Tracking error comes from real world frictions on any single day. Tracking error explains why a 2X ETF might return 1.98% instead of 2.00% on a flat volatility day. It is small, and it is separate from the compounding effect that drives multi day divergence.
Financing costs
Leverage is not free. The fund either borrows to achieve 2X exposure or uses swap contracts that embed a financing cost. That cost drags on returns daily, in small increments.
Swap spreads and dealer markups
The total return swaps that many leveraged funds use carry costs negotiated with counterparties. Tight, but never zero.
Rebalance execution
Adjusting the swap notional at each day’s close carries small transaction costs. These accrue daily regardless of whether the underlying is volatile or trending.
Holding Period
How long should a leveraged ETF be held?
Leveraged ETFs are designed to seek their stated multiple over a single trading day. The label says daily, and the math follows from the label.
Every published prospectus for a 2X daily leveraged ETF makes this explicit. The standard language reads, with minor variations: “The Fund has a daily leveraged investment objective and the Fund’s performance for periods greater than a trading day will be the result of each day’s returns compounded over the period, which is very likely to differ from [2X the underlying’s performance], before fees and expenses.”
What follows from that math, rather than from any view about the product:
- The longer the holding period, the more compounded daily returns diverge from a simple 2X expectation.
- The more volatile the underlying, the larger that divergence, in either direction.
- In a sustained one way move, a leveraged ETF can exceed its stated multiple. In a sideways, choppy market it can fall well short.
- A holder’s actual return depends on which regime characterized the holding period, and it is possible to lose the entire investment.
The SEC Office of Investor Education and Advocacy notes that leveraged and inverse ETFs are meant to be held for a single day or less. Positions held longer should be monitored regularly. The purpose of this page is to make the math visible enough that the choice of how to use these products is made with the design in view.
Common Questions
Leveraged ETF questions, answered
A leveraged ETF is an exchange traded fund that seeks to deliver a multiple of an underlying asset’s return over a single trading day. A 2X leveraged ETF seeks 2X the underlying’s daily return. The fund resets its exposure at each market close, so returns over periods longer than one day are very likely to differ from the stated multiple.
The daily reset is the rebalancing a leveraged ETF performs at each market close so the next trading day begins at exactly the stated multiple of the fund’s new net asset value. When the underlying rises, the fund increases exposure. When the underlying falls, the fund decreases exposure.
Because daily returns compound against different base amounts. If an underlying rises 10% then falls 9.09%, it ends flat, but a 2X ETF gains 20% on a $100 base and then loses 18.18% on a $120 base. The dollar loss exceeds the dollar gain, so the 2X ETF ends down roughly 1.82% before fees and expenses.
Volatility decay is the gap that opens between a leveraged ETF’s cumulative return and the stated multiple of the underlying’s cumulative return when the underlying moves up and down without trending. The effect grows faster than volatility itself. In a hypothetical flat but volatile year, a 2X daily rebalanced ETF on a 30% volatility underlying would be expected to decay roughly 9%, while the same fund on a 100% volatility underlying would be expected to decay roughly 63%.
Yes. In a market that trends consistently in one direction, daily rebalancing compounds exposure in the direction of the move, and the cumulative return can exceed the stated multiple of the underlying’s cumulative return. The same compounding that erodes returns in choppy markets can add to them in trending markets.
A single stock leveraged ETF seeks a multiple of the daily return of one individual company’s stock rather than an index. Because a single company is typically more volatile than a diversified index, the compounding effects described here tend to be larger in single stock leveraged ETFs than in index based ones.
Leveraged ETFs are designed to seek their stated multiple over a single trading day. The SEC Office of Investor Education and Advocacy notes that these products are meant to be held for a single day or less. Positions held longer should be monitored regularly, because compounded daily returns diverge from the stated multiple as the holding period lengthens. These products are not suitable for all investors.
Volatility decay comes from compounding daily returns over multiple days. Tracking error comes from real world frictions on any single day, including financing costs, swap spreads, and rebalance execution costs. Tracking error explains why a 2X ETF might return 1.98% instead of 2.00% on a given day. Volatility decay explains multi day divergence.
Important information. This material is for educational purposes only and is not investment advice or a recommendation to buy or sell any security. Leveraged and inverse ETFs are complex products that are not suitable for all investors. These funds seek daily leveraged or inverse investment results and are intended for sophisticated investors who understand the risks of leverage and who actively monitor and manage their positions. Because these funds reset exposure daily, performance over periods longer than a single trading day will reflect each day’s returns compounded over the period and is very likely to differ from the stated multiple of the underlying’s performance for that period, before fees and expenses. In volatile or range bound markets, a fund may lose value even when the underlying is flat over the period. It is possible to lose the entire amount invested in a single day. Investing in a leveraged or inverse fund is not equivalent to investing directly in the underlying security or index.
All figures, charts, and examples on this page are hypothetical and illustrative. They are calculated from the standard daily rebalanced leverage formula and are not based on the performance of any actual fund, are not a projection of any fund’s results, and do not reflect fees, expenses, or taxes. Past performance is not indicative of future results.
Investors should consider the investment objectives, risks, charges, and expenses carefully before investing. For a prospectus or summary prospectus with this and other information about REX ETFs, please visit rexshares.com. Read the prospectus carefully before investing.
Distributed by Foreside Fund Services, LLC.
Sources: SEC Office of Investor Education and Advocacy, “Updated Investor Bulletin: Leveraged and Inverse ETFs,” investor.gov. Standard 2X daily leveraged ETF prospectus language regarding the daily objective and compounded multi day performance, representative across issuers. Volatility scaling figures: expected returns for a 2X daily rebalanced ETF on a flat underlying, calculated from the standard daily rebalanced leverage formula at each stated annualized volatility. Chart: hypothetical 252 day simulation at 50% annualized volatility with zero drift, with underlying simple returns multiplied by two for the daily rebalanced 2X series. Illustrative, not based on any actual fund. Last reviewed August 2026.
