
REX Autocallable Income ETF (ATCL) April 2026 Commentary
April Recap: Half the Market’s Volatility, Coupons Intact
Key Highlights
- April Distribution: 1.13%
- Distribution Rate: 13.60%
- 30-Day SEC Yield: 2.71%
- April Performance: ATCL: 5.26% | SPXT: 10.49%
- Since Inception Performance (2/18 – 4/30/26): ATCL: 2.22% | SPXT: 4.99%
- Since Inception Beta to S&P 500 TR: ~0.7
- Since Inception Upside Capture: ~60% of S&P 500 TR Index
- Since Inception Downside Capture: ~65% of S&P 500 TR Index
The 30-Day Yield represents net investment income earned by the Fund over the 30-Day period ended 4/30/2026, expressed as an annual percentage rate based on the Fund’s share price at the end of the 30-Day period. The 30-Day unsubsidized SEC Yield does not reflect any fee waivers/reimbursements/limits in effect.
The Distribution Rate is the annual rate an investor would receive if the most recently declared distribution, which includes option income, remained the same going forward. The Distribution Rate is calculated by multiplying an ETF’s Distribution per Share by twelve (12), and dividing the resulting amount by the ETF’s most recent NAV. The Distribution Rate represents a single distribution from the ETF and does not represent its total return. The distribution may include a combination of ordinary dividends, capital gain, and return of investor capital and has the potential to change during any given tax year. Please refer to the 19a-1 Notice, which can be located on the Fund’s website, regarding the composition of distributions, including return of capital. Final determination of a distribution’s tax character will be made on Form 1099 DIV.
Beta measures the sensitivity of a fund’s returns relative to a benchmark index.
Upside Capture measures how much of a benchmark’s positive returns a fund participates in during periods when the benchmark rises.
Downside Capture measures how much of a benchmark’s negative returns a fund participates in during periods when the benchmark declines.
What is the April 2026 Commentary on ATCL Performance and Market Conditions?
- Structured product issuance remained elevated in April, with equity-linked issuance totaling $18B, up 25% year-over-year.
- Equity markets rallied sharply in April, with the S&P 500 TR Index returning 10.49%, as the April 8 US-Iran ceasefire agreement triggered a broad relief rally. Markets appear to be pricing in an eventual normalization of Strait of Hormuz shipping traffic.
- ATCL returned +5.26% in April, delivering strong absolute performance with annualized volatility of just 6.01% — roughly half that of the S&P 500 TR Index (11.72%). The portfolio’s weighted average mark-to-market level rose to 96% from 93% in March, supported by the rally in equity markets. Coupon accrual across the portfolio continues to contribute to total returns.
- Portfolio positioning remains constructive, with all positions currently above their coupon barriers, supporting full coupon eligibility across the portfolio.
- ATCL paid its second distribution in April, with an annualized distribution rate of 13.60%, of which 87.1% was estimated as Return of Capital.
The coupon is the annualized percentage of the notional amount allocated to an Autocallable Contract at the Observation Dates.
The performance data quoted represents past performance and is no guarantee of future results. Investment return and principal value of an investment will fluctuate so that an investor’s shares, when redeemed, may be worth more or less than their original cost. Current performance may be lower or higher than the performance data quoted. For the most recent Standardized Performance and month-end performance, please call 1-844-802-4004.
Portfolio Highlights
| Live Autocallables | 287 |
| Weighted Avg. Coupon | 14.26% |
| Weighted Avg. MTM Discount | 96.42% |
| % Above Coupon Barrier | 100% |
| Autocallables with Principal at Risk | 0 |
Live Autocallables: shows how many autocallables are still outstanding and have not yet been called or matured.
Weighted Avg. Coupon: Shows the weighted average yearly coupon currently paid across all active autocallables. Distribution percentage shown is preliminary. The final distribution amount will be set by the fund manager.
Weighted Avg. MTM Discount: Shows the average current market price of live autocallables as a percentage of par (100%), weighted by position size.
Autocallables with Principal at Risk: Shows number of autocallables currently below maturity barriers and with one year or less until maturity.
Performance Summary
April: 4/1 – 4/30/26 • Since Inception: 2/18 – 4/30/26 (ATCL inception: 2/18/26)
| Ticker | Fund Name | April | Since Inception |
|---|---|---|---|
| ATCL | REX Autocallable Income ETF (NAV) | 5.26% | 2.22% |
| SPXT | S&P 500 Total Return Index | 10.49% | 4.99% |
For current standardized performance, click here.
The performance data quoted represents past performance. Past performance does not guarantee future results. The investment return and principal value of an investment will fluctuate so that an investor’s shares, when sold or redeemed, may be worth more or less than their original cost and current performance may be lower or higher than the performance quoted. Performance current to the most recent month-end can be obtained by calling 1-844-802-4004.
The Fund’s gross expense ratio is 0.74%.
Since Inception Cumulative Return
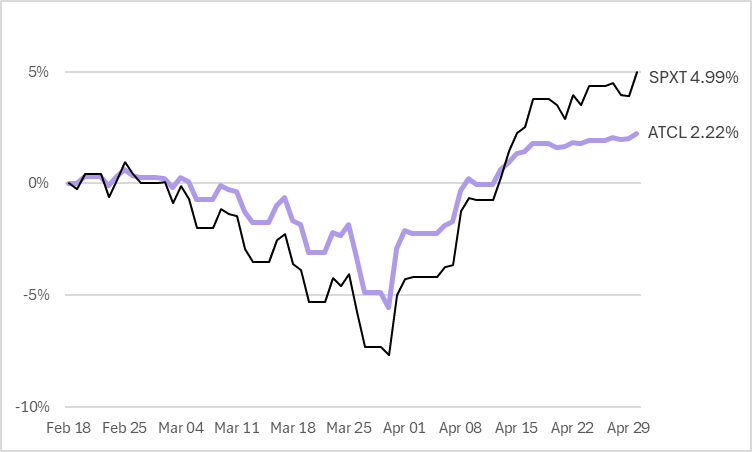
Data as of 4/30/26. Source: Bloomberg. Daily total returns. Inception: February 18, 2026. Past performance is not indicative of future results.
